You have spent days, weeks, or months designing your website and creating content to engage your readers. However, all of that effort will be for nothing if your website pages load slowly. Page speed should be one of your top priorities as a website owner in today’s fast-paced digital world. Visitors will leave and search elsewhere if your pages take too long to load. Page speed insights and reports provide a wealth of information to help you optimise your page loading times.
In this article, you will discover how to generate page speed insights and reports for your website. You will learn how to analyse the results to uncover issues hindering your page load speeds. Then, you will find out how to make changes to resolve those issues and improve your Google PageSpeed scores, all of which can help boost visitor satisfaction and search engine rankings. Optimising page speed is a continual process, but with the help of page speed insights and reports, you will be well on your way to faster loading, higher-performing web pages.
What Is PageSpeed Insights?
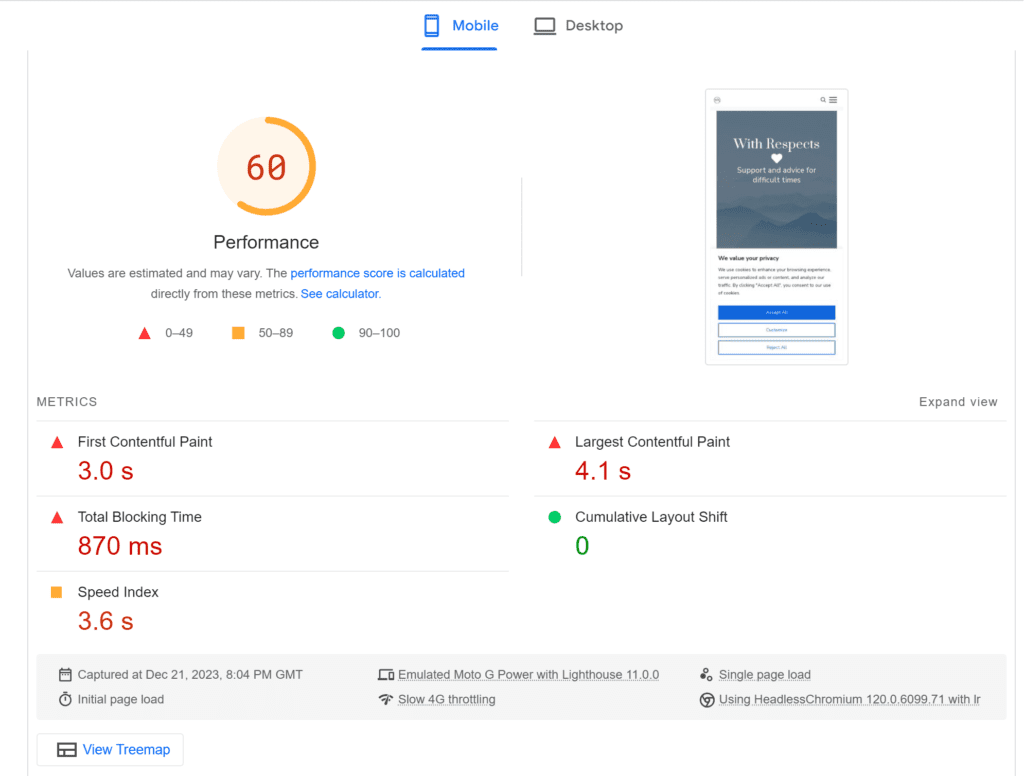
PageSpeed Insights is a free tool by Google that analyzes the performance of your web pages and provides tailored suggestions on how you can optimize them for a better user experience. It examines your page’s content and provides a PageSpeed Score from 0 to 100, indicating how fast your page loads and how you can improve.
The PageSpeed Score considers multiple factors that affect page load time and user experience. This includes the size of files, number of requests, and how quickly the page responds. Optimizing these factors can significantly improve your page’s speed and mobile-friendliness, which leads to better search rankings, higher conversion rates, and increased user satisfaction.
PageSpeed Insights generates two types of reports – mobile and desktop – based on analyses of how your page performs on each device. The reports provide actionable recommendations and metrics on opportunities for improvement. They outline issues with page assets that are slowing down load time and potential solutions to fix them. The key is to review the reports regularly and implement the recommended optimizations to keep improving your scores over time.
Some of the common recommendations include:
- Minifying CSS, JavaScript, and HTML code to reduce file sizes
- Compressing images and enabling lazy loading
- Removing render-blocking resources
- Optimizing caching to reduce server load
- Prioritizing visible content
- Reducing excess DOM size
By following the recommendations from PageSpeed Insights, you can craft fast, engaging web experiences for your users and reap the benefits of an optimized, high-performing website. Continuous monitoring and improvement of your pages’ speed will lead to long-term success.
How to Use PageSpeed Insights
To properly analyze and improve your website’s speed and performance, utilize the PageSpeed Insights tool. This invaluable resource, provided for free by Google, will evaluate your site and provide tailored recommendations for optimizing its loading time.
To get started, enter the URL of your website into the PageSpeed Insights search bar. The analysis will take a few seconds to run, then your homepage’s speed score, from 1 to 100, will be displayed. A higher score indicates a faster, better-optimized site.
Viewing the Analysis Reports
Two reports are provided: Mobile and Desktop. Select ‘Mobile’ first, as mobile page speed is increasingly important for search ranking and user experience. The report gives you an overview of how long your site takes to load, and lists specific issues slowing it down. Common problems include:
- Large image sizes: Compress images to the smallest size possible while maintaining quality.
- Render-blocking JavaScript and CSS: Move scripts to the bottom of pages or make them asynchronous.
- Unused CSS: Remove unused CSS rules.
- Too many redirects: Minimize redirects to improve load time.

The ‘Desktop’ report provides the same insights for the desktop version of your site. Address the flagged issues in both reports to significantly improve your speed score and user experience.
Continually re-check PageSpeed Insights and make optimizations to keep improving your score over time. Fast, mobile-friendly websites lead to lower bounce rates, higher rankings, and more traffic and conversions. PageSpeed Insights is an invaluable tool for any site owner looking to boost performance.
PageSpeed Insights provides two types of data to help you optimize your website’s performance: lab data and field data. Understanding the difference between these data sets can help you better interpret PageSpeed reports and make informed decisions about optimizing your site.
Lab Data
Lab data is gathered in a controlled testing environment using the latest web browsers on high-end desktop and mobile devices with fast network connections. The lab data report provides a technical analysis of how well your page is optimized based on web performance best practices. It checks factors such as:
- Minifying CSS and JavaScript files to reduce their size
- Compressing images and enabling lazy loading
- Removing render-blocking JavaScript and CSS from above the fold
- Optimizing the critical rendering path to enable a fast first meaningful paint
The lab data report gives you specific actionable recommendations for optimizing the technical performance of your page. By implementing these recommendations, you can significantly improve your PageSpeed scores and rankings.
Field Data
Field data is collected from real-user page loads on a variety of devices and network conditions. The field data report provides an analysis of how real users are experiencing your page in the wild. It checks factors such as:
- Page load times based on device, browser, and location
- First meaningful paint times showing when content is rendered on the screen
- First input delay showing how responsive the page is to user input
- Long task metrics highlighting JavaScript tasks that block the main thread
The field data report gives you insight into real-world performance bottlenecks and a better understanding of how your page can be optimized to provide the best experience for all your users. By monitoring field data over time, you can see the impact of changes made to your page and continue to optimize based on user needs.
Using the data and recommendations from both lab and field reports will provide the most comprehensive guidance for improving your page speed and user experience. Continually optimizing based on these factors can significantly boost your search rankings, user engagement, and conversions.
Core Web Vitals Report
The Core Web Vitals report provides an overview of your page’s performance based on Google’s Core Web Vitals metrics. This report gives you insight into three key areas that impact user experience and search ranking:
Largest Contentful Paint
Largest Contentful Paint (LCP) measures the time it takes for the largest content element on your page to load. Aim for LCP of 2.5 seconds or less. To improve, optimise images and prioritise loading of above-the-fold content.
First Input Delay
First Input Delay (FID) measures the time it takes for your page to respond to a user’s first interaction, like a tap or click. Strive for FID of 100 milliseconds or less. To enhance, minimise JavaScript execution times and reduce unused CSS and JS.
Cumulative Layout Shift
Cumulative Layout Shift (CLS) measures the instability of page elements by checking if they change position as the page loads. Target a CLS score of 0.1 or less. To strengthen, fix the position and size of page elements on initial load to prevent movement.
Interaction to Next Paint
INP measures how quickly a webpage reacts to user interactions. If a page takes too long to respond, users might leave, never to return.
The report will display your scores for these metrics compared to the recommended targets. It also provides a summary of passed, average and failed metrics to see where improvements are needed quickly. By expanding each metric, you can view details on how that score was calculated and suggestions on how to enhance it.
Monitoring your Core Web Vitals scores and making ongoing optimisations to reach the recommended targets will have significant benefits for your users and search ranking. Focusing on user experience by improving page load speed, responsiveness and stability creates a better overall impression of your site. Strong Core Web Vitals also help demonstrate to Google that you prioritise the user, which can positively impact your search results position.
Regularly checking your Core Web Vitals report in Page Speed Insights and using the tailored suggestions provided is the best way to gain insight into your site’s performance and make meaningful improvements. Optimising for the metrics in this report should be an ongoing process to achieve and maintain a good user experience.
Accessibility Best Practices

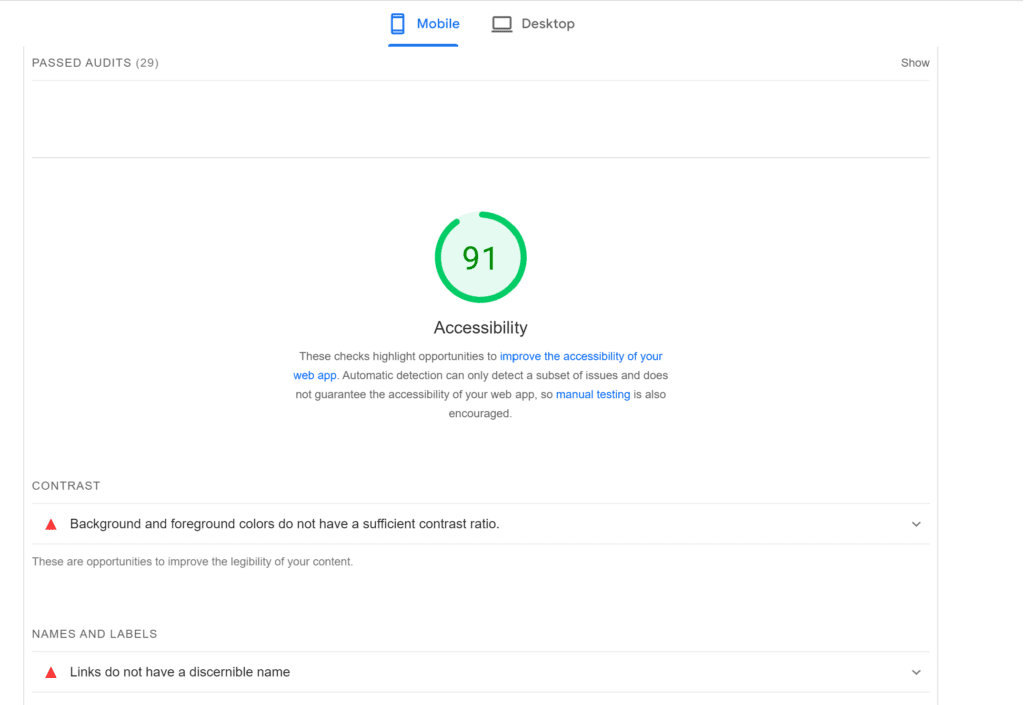
The Accessibility Report provides an overview of accessibility issues that could impact users’ experience with disabilities. This report analyses your page against the Web Content Accessibility Guidelines (WCAG) 2.1, which covers common issues relating to:
Perceivable
Content must be presentable to users in ways they can perceive. This includes providing text alternatives for non-text content like images, videos and audio. The Accessibility Report checks for issues like:
- Missing alternative text for images
- Lack of captions or audio descriptions for video and audio content
Operable
Interface components and navigation must be operable. This includes ensuring all functionality is available from a keyboard, content is not restricted to a single sense like vision, and users have enough time to read and use content. The report checks for issues such as:
- Buttons, forms and links that cannot be accessed via keyboard
- Timing restrictions that do not provide users enough time
- Content that cannot be understood by screen readers
Understandable
Information and the operation of the interface must be understandable and easy to comprehend. The report checks for issues such as:
- Page language not specified
- Unclear link text
- Confusing page titles
Robust
Content must be robust enough to be interpreted reliably by a wide variety of user agents, including assistive technologies. This includes ensuring markup is valid and error-free. The report checks for issues such as:
- Invalid HTML
- Duplicate IDs
- Unsupported HTML tags
By reviewing and addressing the issues identified in the Accessibility Report, you can make significant improvements to the accessibility and inclusiveness of your site for users with disabilities. Overall, continually optimizing for accessibility and an optimal user experience for all is well worth the effort.
Best Practices for Improving PageSpeed Scores

To improve your PageSpeed scores and overall site performance, there are several best practices you should follow. We’ve outlined some below; or you can read our in-depth guide on improving Core Web Vitals.
Server optimisation
In addition to front-end optimisation, you need to consider how your server is configured:
- Enable compression (gzip or deflate) to reduce the size of HTML, CSS, JS and image files.
- Use a content delivery network (CDN) to serve static assets. A CDN will cache assets on servers around the world improving load times.
- Make sure your server has enough bandwidth and isn’t overloaded. If your server is slow, it will directly impact page load speeds.
- Consider using a faster web server like Nginx instead of Apache. Nginx typically has better performance for static content.
By following these best practices, you’ll see significant improvements in your PageSpeed scores, faster page load times and an overall better experience for your visitors. Be sure to regularly check PageSpeed Insights and your server performance metrics to identify any areas that could benefit from optimisation. Improving site speed and performance should be an ongoing process.
Compress Your Images
Compressing images reduces their file size, allowing them to load faster. You can compress images in several ways:
- Use an image compressor tool like TinyPNG, JPEGmini or Kraken.io. Upload your images and the tool will compress them while preserving quality.
- Enable compression in your content management system or blogging platform. Many platforms like WordPress have built-in options to automatically compress images on upload
- Manually compress images before uploading using a tool like Photoshop. Go to File -> Export -> Save for Web (Legacy) and adjust the quality setting. Aim for 60-80% quality.
- Delete excess metadata from images. Metadata includes camera settings, location, date and more. It adds to the file size but is not needed on the web page. You can use a metadata removal tool for this.
Choose the Right File Format
Use the most appropriate file format for your images. JPEG is good for photos, PNG is better for logos and text, and GIF works well for animations. Avoid using BMP, TIFF and RAW image formats.
Lazy Load Your Images
Lazy loading images means delaying the loading of off-screen images until the user scrolls to them. This can improve your page speed by not loading images that may never be seen. Many content management systems and plugins offer lazy loading functionality.
Use Responsive Images
Responsive images are sized to match the viewport they are displayed in. This means serving smaller image files to mobile devices and larger images to desktops. Make sure to specify image widths in your page markup so the correct responsive image is loaded.
Optimizing your images and media is an easy way to boost your page speed and provide a better user experience. Following these best practices for compressing, choosing formats, lazy loading and using responsive images can significantly improve load times.
FAQ on Using PageSpeed Insights and Core Web Vitals Reports
To improve your page speed scores and user experience, minimising CSS and JS files, and removing render-blocking resources are two key optimisations to focus on.
Minifying CSS/JS
Minification refers to removing unnecessary characters from CSS and JS code without changing its functionality. This includes:
- Removing comments
- Removing whitespace and newline characters
- Shortening variable names
Minifying your CSS and JS files can significantly reduce their size and improve load times. You can use free online tools like CSS Minifier and JSCompress to minify your code. Be sure to minify files before deploying to production.
Removing Render-Blocking Resources
Render-blocking resources are CSS and JS files located in the <head> of your HTML. They block the initial render of your page content until they have loaded and executed. To improve page speed, move these files to the bottom of the <body>, just before the closing </body> tag.
This allows your page to render the content first, then load the CSS and JS afterwards. Users will experience a faster loading page, even if the CSS and JS files take a few extra milliseconds to load.
Some additional tips for optimising render-blocking resources:
- Combine all CSS files into one and all JS files into one to minimise HTTP requests.
- Consider inlining small CSS files directly into your HTML to avoid an extra HTTP request.
- Defer loading of JS files that are not critical to initial page render.
- Preload important CSS/JS files so the browser can start downloading them immediately.
By focusing on minifying your site’s CSS and JS, removing render-blocking resources, and optimising the loading of critical files, you can significantly improve your page speed scores and user experience. These straightforward fixes should be part of any site optimisation process.

